

MY DRINKS DIARY
A quantified-self app to track alcohol consumption
OVERVIEW
Role: UX / UI Design and Web Development
Individual Work for NYU ITP's "Designing for Data Personalization" class taught by Sam Slover
Fall 2015
My Drinks Diary is self-tracking web and mobile application that tracks and visualizes how much alcohol I've consumed. The Alcohol usage dataset is tracked from August 2015 to October 2015 and related information is displayed in a colored calendar format.
BRAINSTORMING / ROUGH SKETCHES

ELEMENTS
- Date
- Type of drinks - Beers, Cocktails, Whiskey, Tequila, and etc.
- Location
- People I drink with
- Time spent
- Total / Average per day
- Dollars spent
- Total / Average per day
- Inebriation - None / Good / Tipsy / Bad / Binge
WIREFRAME & Prototype Version 1


PROTOTYPE VERSION 2

WORK FLOW
- Create a JSON file
- Render my JSON onto a webpage
- Create a cohesive Web page utilizing a combination of regular HTML/CSS/JS, 3rd party Javascript libraries (Chart.js and Heatmap.js)
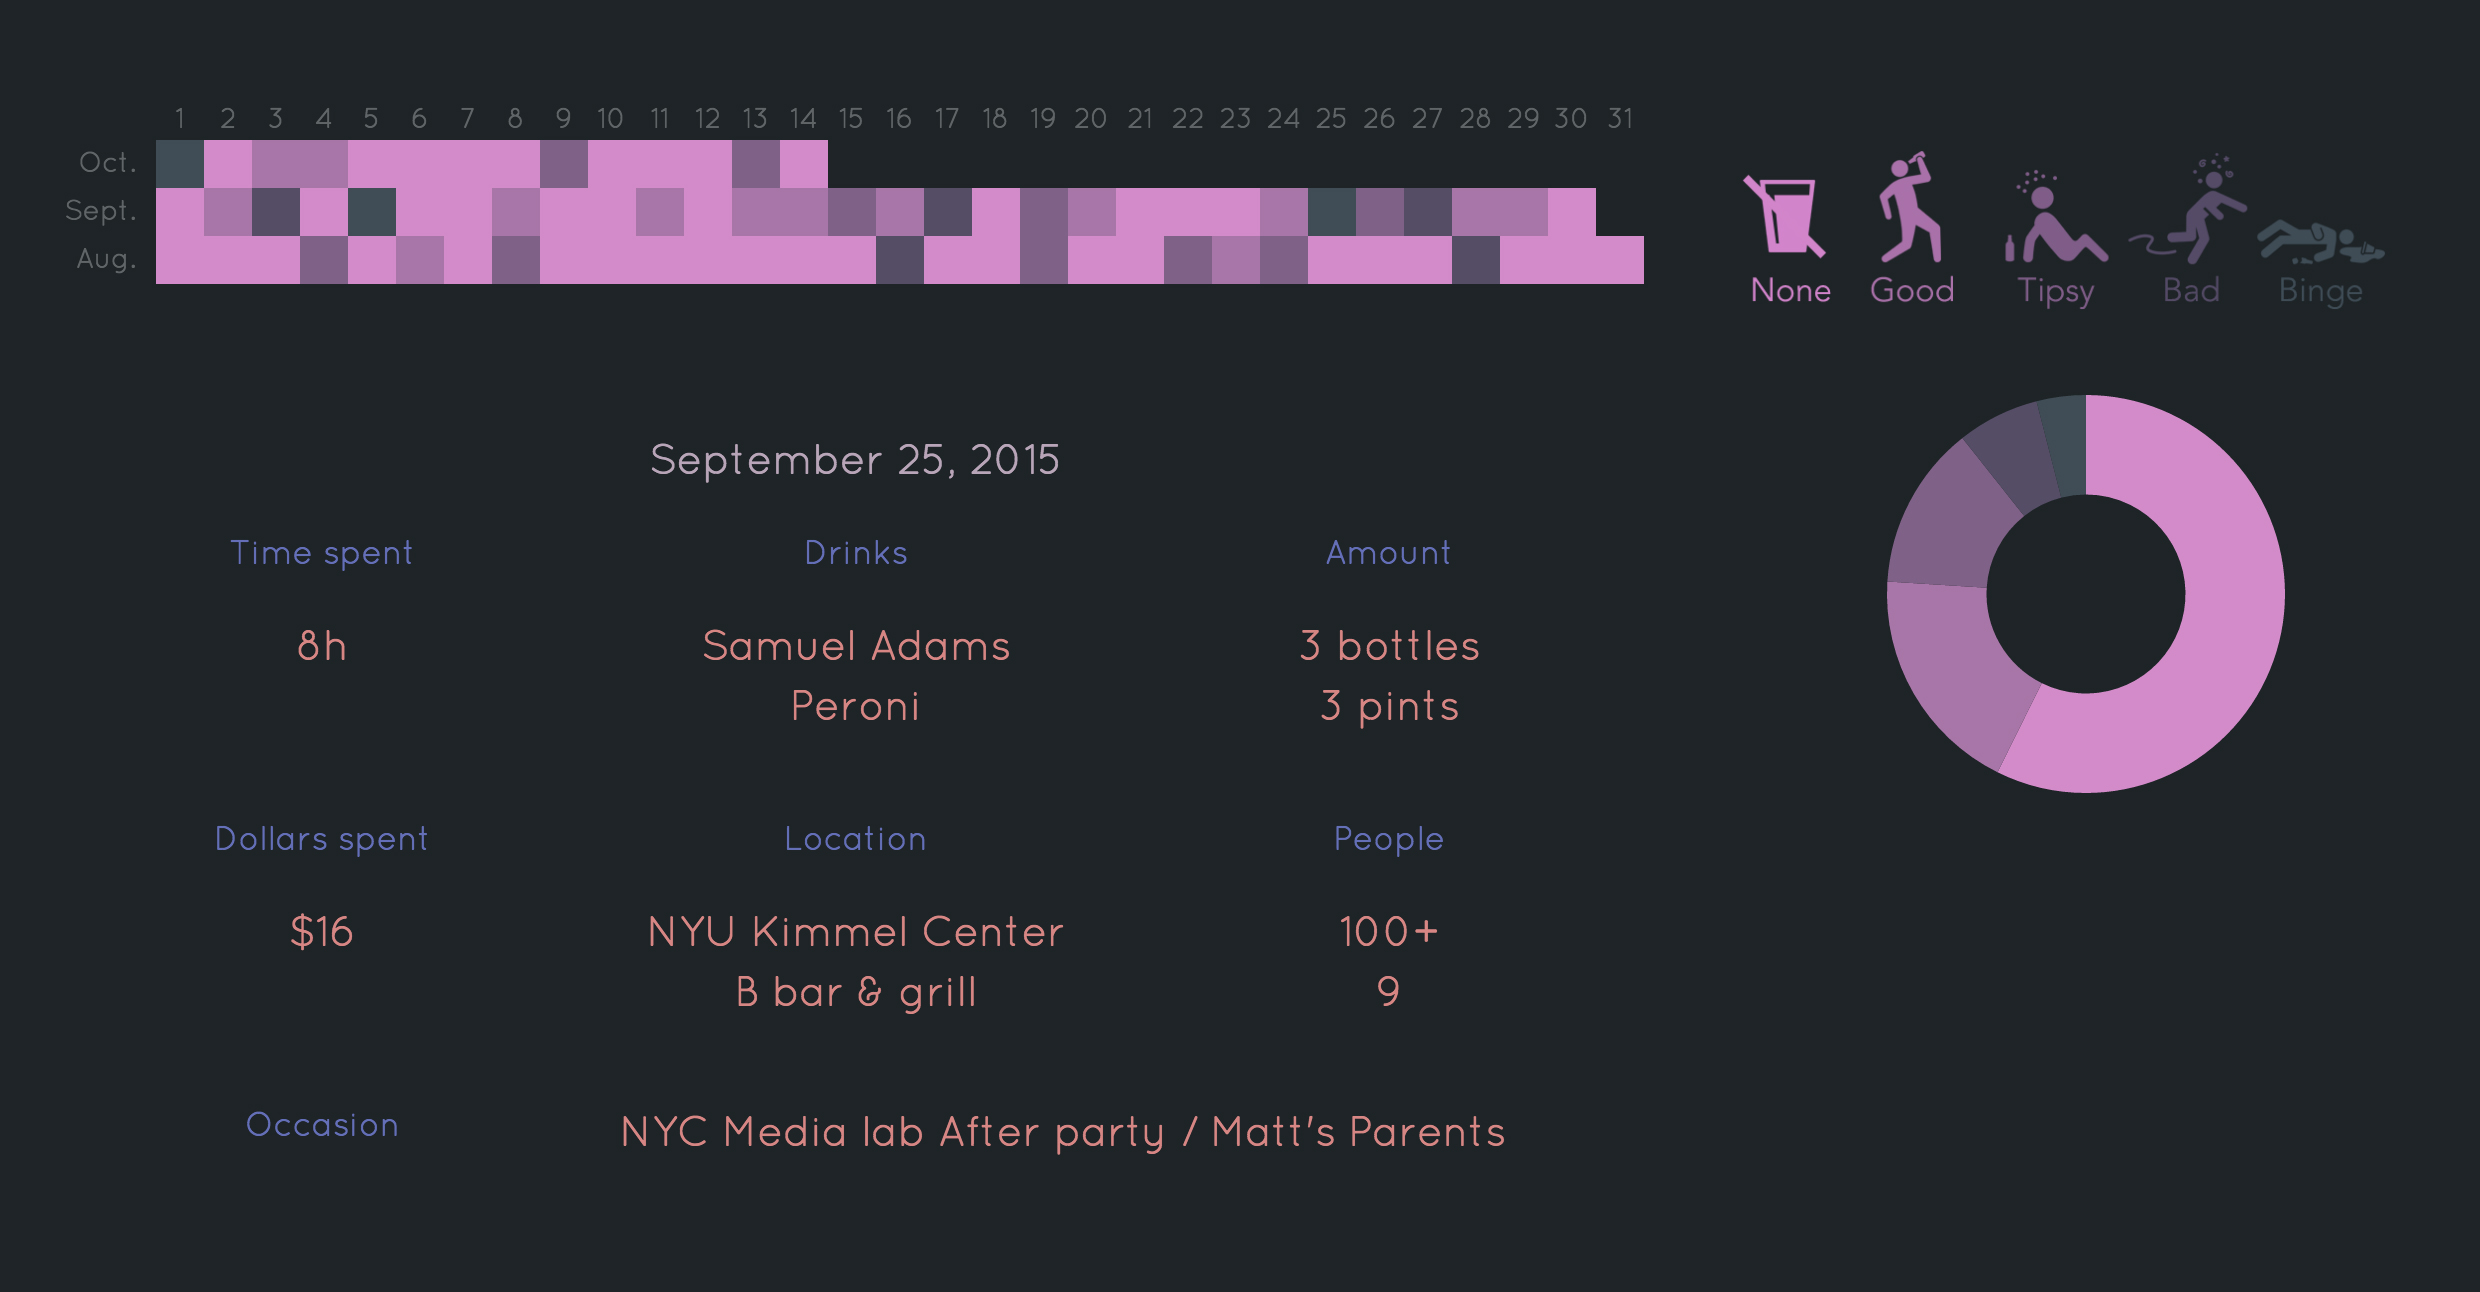
final VERSION interface
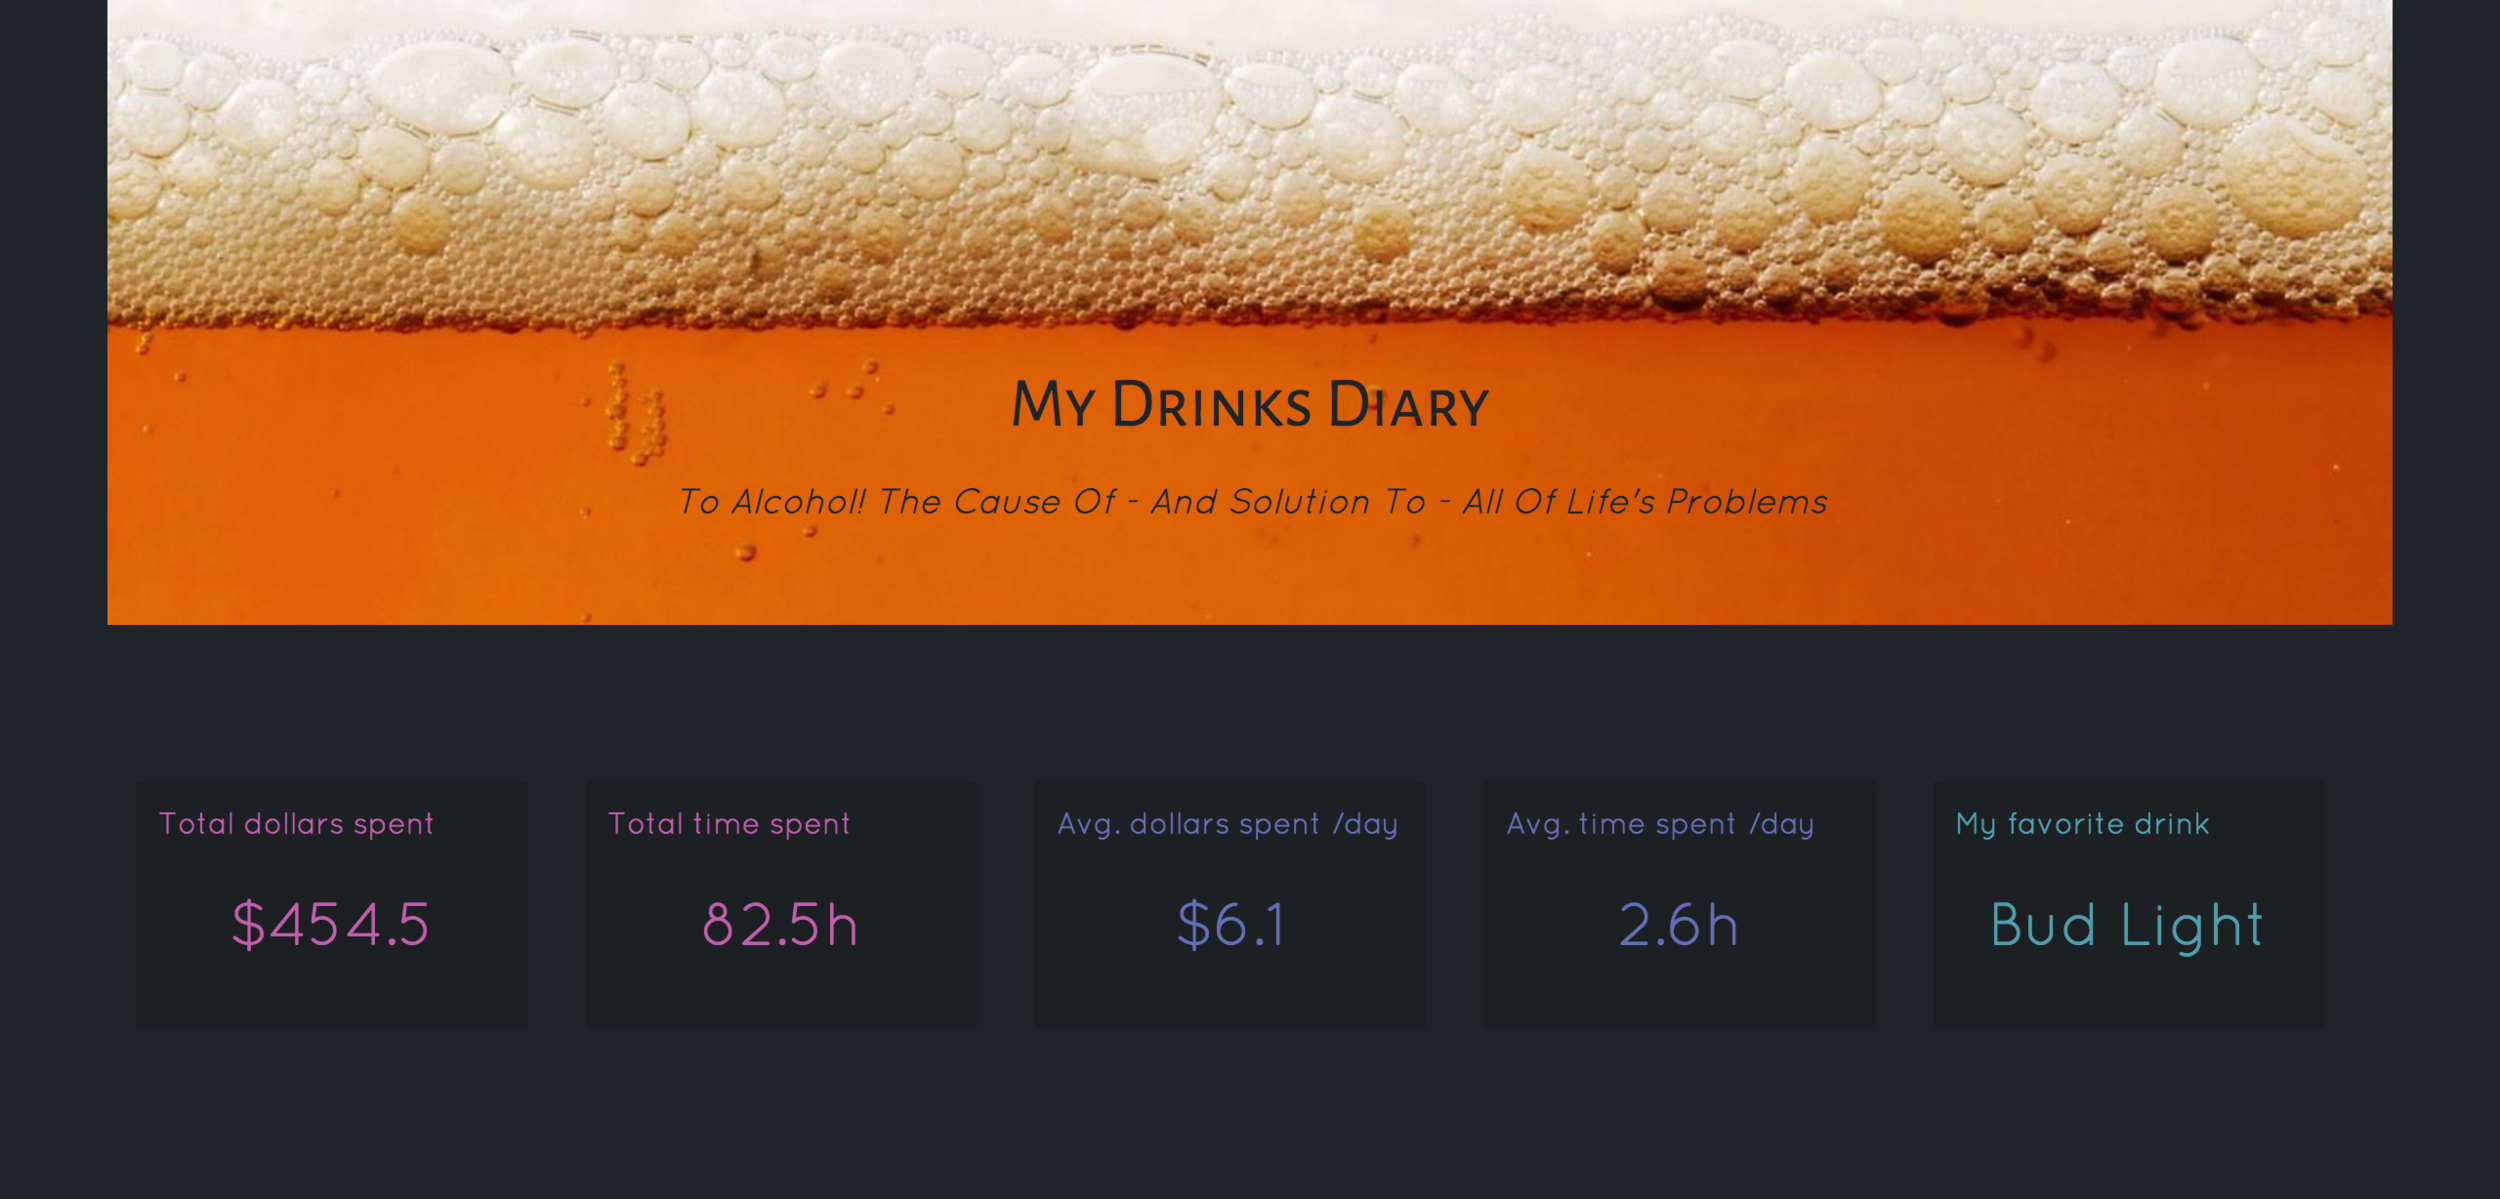
I used the D3.js-based Day/Hour Heatmap to visualize the data. The more I consumed, the darker the color on the visualizations become. You can see from the daily map that I usually over-consumed around the weekend. When you hover over each day unit, all the information about that day is shown at the bottom of the map. The pie chart visualizes the ratio of inebriation.
The data is linked to Google maps to visualize geo-location. It shows a more solid color based on the frequency of visiting a place.

To view the making of this project, please click here >>